
USDA Week 9 Stat Profile Report
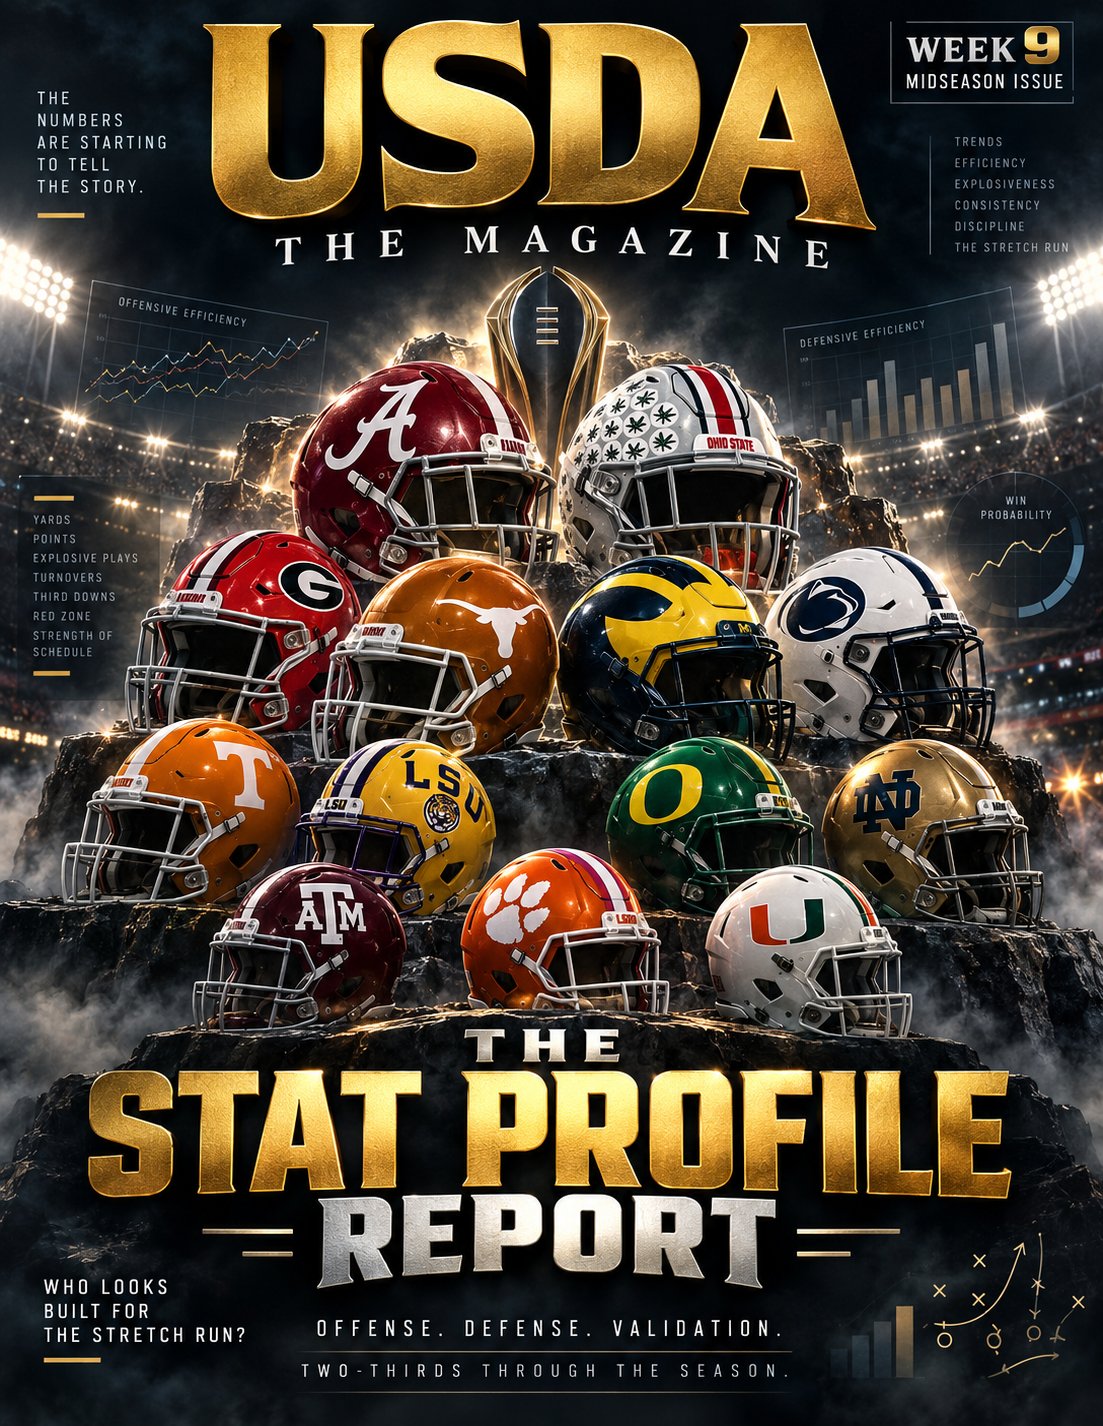
We’ve reached the two-thirds mark of the USDA season, and the numbers are finally starting to separate perception from reality.
In the Week 9 Stat Profile Report, we break down every team’s full offensive and defensive profile, show where each unit ranks across the league, and add the context raw averages can’t provide: how much of that production has actually held up against user competition, who those opponents were, and how each team performed when the difficulty increased.
Some teams are winning with explosive offense. Others are building around dominant defense, pressure, red-zone efficiency, or possession football. Some profiles look incredibly complete. Others are being carried by one elite trait. And a few teams have season-long numbers that become much more interesting once user-game performance is layered in.
Every team gets a full offensive analysis, defensive analysis, complete stat profile, and a Contender Level from 1–10 based on how strongly the current numbers resemble a national-title caliber team.
We also close with the Top 10 Offenses, Top 10 Defenses, and Top 10 Overall Stat Profiles in USDA.
At this point, the question isn’t just who has the best record.
It’s who actually looks built to survive the stretch run.
🏈 USDA WEEK 9 — THE CONTENDER STAT REPORT
We’ve reached roughly the two-thirds mark of the season.
The early-season noise is beginning to disappear.
Offensive identities have formed. Defensive strengths are becoming repeatable. Weaknesses are becoming harder to hide. And with enough user games now on the board, we can start separating teams that simply have impressive numbers from teams whose numbers are beginning to look like a legitimate national championship profile.
This report looks at the complete picture:
Offensive production. Defensive production. USDA rank in every major category. User-game exposure. Performance against users. And how convincingly those pieces fit together.
User-game volume matters, but it does not automatically determine where a team belongs. A team with fewer user games can still have an elite statistical profile; it simply carries less validation than a team whose production has already survived five or six user matchups.
The final question for every team:
CONTENDER LEVEL — 1 to 10
How strongly does the current statistical profile resemble a team capable of winning the USDA National Championship?
This is based on the profile, not simply record or reputation.
All category ranks are among 28 USDA teams. Ties share the same rank.
⸻
ALABAMA
⚔️ OFFENSE
PPG: 29.5 (#19)
YPG: 327.9 (#26)
YPP: 6.3 (#19)
Pass: 174.3 (#24)
Rush: 153.6 (#18)
3rd Down: 50% (#7)
Red Zone: 45% (#13)
🛡️ DEFENSE
PPG Allowed: 21.8 (#16)
YPG Allowed: 291.1 (#9)
Pass Allowed: 182.8 (#9)
Rush Allowed: 108.4 (#12)
Sacks: 20 (#13)
INT: 10 (#15)
Red-Zone TD Allowed: 29% (#9)
🎮 USER VALIDATION — 4/8 | 3-1
Florida State — W
South Carolina — L
Mississippi State — W
Texas A&M — W
⚔️ OFFENSE ANALYSIS
The raw offensive profile is modest. Alabama sits #19 in scoring and #26 in total offense, without an elite passing or rushing component.
The interesting part is that the offense has actually performed better against users, averaging 32.5 points in four user games.
That gives the scoring profile more credibility than the season-long yardage ranks suggest.
🛡️ DEFENSE ANALYSIS
Alabama’s defense doesn’t dominate one category, but it also lacks a major statistical weakness.
Top 12 in total defense, passing defense, rushing defense and red-zone defense gives Alabama one of the more structurally balanced units in USDA.
📊 STAT PROFILE
Solid two-way team whose user results are somewhat stronger than its raw offensive statistics.
🏆 CONTENDER LEVEL: 7.0 / 10
The defense is good enough and the user record provides meaningful validation. The biggest thing separating Alabama from the highest-level profiles is the absence of a truly elite offensive category.
⸻
ARKANSAS
⚔️ OFFENSE
PPG: 27.5 (#20)
YPG: 403.5 (#10)
YPP: 6.7 (#13)
Pass: 203.1 (#15)
Rush: 200.4 (#7)
3rd Down: 48% (#12)
Red Zone: 46% (#11)
🛡️ DEFENSE
PPG Allowed: 17.9 (#6)
YPG Allowed: 304.6 (#11)
Pass Allowed: 161.9 (#3)
Rush Allowed: 142.8 (#27)
Sacks: 7 (#28)
INT: 7 (#21)
Red-Zone TD Allowed: 50% (#26)
🎮 USER VALIDATION — 2/8 | 2-0
Texas A&M — W
Missouri — W
⚔️ OFFENSE ANALYSIS
Arkansas is much more productive than the #20 scoring rank suggests.
This is one of only a handful of teams producing roughly 200 yards passing and 200 rushing per game, and the Razorbacks sit #10 in total offense.
The question is finishing drives consistently enough to turn that balance into points.
🛡️ DEFENSE ANALYSIS
This is one of USDA’s strangest defenses.
Arkansas is #6 in scoring defense and #3 against the pass while simultaneously ranking #28 in sacks, #27 against the run and #26 in red-zone TD defense.
Yet through two user games Arkansas has allowed only 8.5 PPG.
📊 STAT PROFILE
One of the more intriguing statistical teams. The yardage says the offense is better than its scoring rank, while the scoring defense is dramatically better than some of its underlying defensive categories.
🏆 CONTENDER LEVEL: 7.0 / 10
The balance and scoring defense are intriguing, but the defensive profile contains several warning signs. More user games will tell us whether the 17.9 PPG defense is truly sustainable.
⸻
AUBURN
⚔️ OFFENSE
PPG: 20.3 (#27)
YPG: 328.6 (#25)
YPP: 5.7 (#25)
Pass: 175.0 (#23)
Rush: 153.6 (#18)
3rd Down: 47% (#14)
Red Zone: 50% (#7)
🛡️ DEFENSE
PPG Allowed: 24.9 (#23)
YPG Allowed: 362.4 (#27)
Pass Allowed: 238.5 (#28)
Rush Allowed: 123.9 (#19)
Sacks: 18 (#19)
INT: 7 (#21)
Red-Zone TD Allowed: 40% (#21)
🎮 USER VALIDATION — 3/8 | 0-3
Florida — L
LSU — L
Ole Miss — L
⚔️ OFFENSE ANALYSIS
Auburn simply isn’t creating enough explosive or sustained offense.
The Tigers rank #27 scoring, #25 total offense and #25 YPP. The 50% red-zone rate is useful, but Auburn isn’t reaching scoring territory often enough.
🛡️ DEFENSE ANALYSIS
The biggest problem is through the air.
Auburn ranks #28 in pass defense and #27 in total defense. There is no elite sack or takeaway production compensating for that yardage leakage.
📊 STAT PROFILE
Too many bottom-quartile categories on both sides to currently resemble a contender profile.
🏆 CONTENDER LEVEL: 2.5 / 10
The profile currently lacks a championship-caliber foundation on either side of the ball.
⸻
CLEMSON
⚔️ OFFENSE
PPG: 25.6 (#24)
YPG: 304.0 (#27)
YPP: 5.2 (#27)
Pass: 162.1 (#25)
Rush: 141.9 (#23)
3rd Down: 37% (#28)
Red Zone: 39% (#19)
🛡️ DEFENSE
PPG Allowed: 24.8 (#22)
YPG Allowed: 322.0 (#18)
Pass Allowed: 234.3 (#26)
Rush Allowed: 87.8 (#8)
Sacks: 19 (#16)
INT: 12 (#9)
Red-Zone TD Allowed: 32% (#13)
🎮 USER VALIDATION — 3/8 | 0-3
LSU — L
Miami — L
Florida State — L
⚔️ OFFENSE ANALYSIS
The offense is the clear limiting factor.
Clemson ranks #27 in total offense, #27 YPP and dead last on third down. Against users, scoring falls further to 14.7 PPG.
🛡️ DEFENSE ANALYSIS
The defense has legitimate strengths.
The Tigers are #8 against the run and Top 10 in interceptions, but pass defense remains a major weakness at #26.
📊 STAT PROFILE
The defense has useful pieces. The offense is currently the limiting factor.
🏆 CONTENDER LEVEL: 3.0 / 10
The defensive foundation is respectable, but the offense currently lacks the efficiency needed to survive a championship path.
⸻
FLORIDA
⚔️ OFFENSE
PPG: 35.1 (#9)
YPG: 353.3 (#21)
YPP: 7.1 (#9)
Pass: 218.4 (#10)
Rush: 134.9 (#25)
3rd Down: 43% (#23)
Red Zone: 37% (#21)
🛡️ DEFENSE
PPG Allowed: 22.0 (#17)
YPG Allowed: 349.4 (#26)
Pass Allowed: 182.0 (#8)
Rush Allowed: 167.4 (#28)
Sacks: 23 (#9)
INT: 20 (#1)
Red-Zone TD Allowed: 40% (#21)
🎮 USER VALIDATION — 6/8 | 5-1
Auburn — W
Ole Miss — W
Missouri — W
South Carolina — W
Texas — L
Georgia — W
⚔️ OFFENSE ANALYSIS
Florida’s offensive ranking becomes more impressive once the schedule is considered.
The Gators average 35.1 PPG overall and 34.2 against users despite playing six user games — the largest sample in USDA.
That is extremely strong validation.
🛡️ DEFENSE ANALYSIS
The defense is volatile.
Florida ranks #26 in total defense and #28 against the run, but leads the entire league with 20 interceptions.
That means the Gators don’t consistently prevent yardage — they end possessions.
📊 STAT PROFILE
One of the season’s most validated offenses. Florida’s unusual equation is explosive scoring + enormous turnover production covering significant yardage leakage defensively.
🏆 CONTENDER LEVEL: 8.0 / 10
The offense is proven against users and the defense possesses an elite game-changing trait. The concern is whether turnover production can continue compensating for the amount of yardage Florida allows.
⸻
FLORIDA STATE
⚔️ OFFENSE
PPG: 34.0 (#12)
YPG: 364.3 (#18)
YPP: 6.7 (#13)
Pass: 216.5 (#11)
Rush: 147.8 (#21)
3rd Down: 38% (#26)
Red Zone: 27% (#27)
🛡️ DEFENSE
PPG Allowed: 21.6 (#15)
YPG Allowed: 311.6 (#16)
Pass Allowed: 178.0 (#6)
Rush Allowed: 133.6 (#23)
Sacks: 20 (#13)
INT: 17 (#2)
Red-Zone TD Allowed: 39% (#19)
🎮 USER VALIDATION — 5/8 | 3-2
SMU — W
Alabama — L
Virginia — W
Miami — L
Clemson — W
⚔️ OFFENSE ANALYSIS
FSU scores at a strong rate despite poor situational efficiency.
Ranking #26 on third down and #27 in the red zone while still averaging 34 points suggests the Seminoles are generating significant offense through explosive plays.
🛡️ DEFENSE ANALYSIS
The calling card is obvious: 17 interceptions, #2 in USDA.
The pass defense is also #6, giving Florida State a legitimate strength against passing-oriented teams.
📊 STAT PROFILE
A dangerous team driven more by explosive offense and defensive takeaways than consistent situational dominance.
🏆 CONTENDER LEVEL: 7.0 / 10
The upside is real and the user sample is substantial. The situational offensive numbers prevent this from looking like one of the league’s cleanest championship profiles.
⸻
GEORGIA
⚔️ OFFENSE
PPG: 26.5 (#22)
YPG: 388.3 (#13)
YPP: 6.3 (#19)
Pass: 230.8 (#7)
Rush: 157.5 (#17)
3rd Down: 38% (#26)
Red Zone: 26% (#28)
🛡️ DEFENSE
PPG Allowed: 26.4 (#26)
YPG Allowed: 336.4 (#22)
Pass Allowed: 209.9 (#18)
Rush Allowed: 126.5 (#20)
Sacks: 18 (#19)
INT: 7 (#21)
Red-Zone TD Allowed: 58% (#27)
🎮 USER VALIDATION — 1/8 | 0-1
Florida — L
⚔️ OFFENSE ANALYSIS
Georgia’s offense moves the football better than its scoring average suggests.
The Bulldogs are #13 in yardage and #7 passing, but rank dead last in offensive red-zone efficiency.
The issue isn’t reaching scoring territory. It’s finishing.
🛡️ DEFENSE ANALYSIS
There is no single catastrophic yardage statistic, but there is also no elite category carrying the unit.
The largest problem is the 58% red-zone TD rate allowed, #27 in USDA.
📊 STAT PROFILE
Better between the 20s than the scoring numbers show, but red-zone inefficiency on both sides has been costly.
🏆 CONTENDER LEVEL: 3.5 / 10
The yardage profile gives Georgia some theoretical upside, but championship teams rarely survive with bottom-two red-zone performance on both sides.
⸻
INDIANA
⚔️ OFFENSE
PPG: 35.2 (#8)
YPG: 461.3 (#1)
YPP: 7.8 (#3)
Pass: 332.7 (#2)
Rush: 128.7 (#26)
3rd Down: 45% (#17)
Red Zone: 37% (#21)
🛡️ DEFENSE
PPG Allowed: 23.3 (#20)
YPG Allowed: 305.0 (#13)
Pass Allowed: 196.6 (#13)
Rush Allowed: 108.4 (#12)
Sacks: 26 (#5)
INT: 12 (#9)
Red-Zone TD Allowed: 43% (#24)
🎮 USER VALIDATION — 3/9 | 1-2
Nebraska — W
Ohio State — L
Michigan — L
⚔️ OFFENSE ANALYSIS
Indiana’s production is enormous.
#1 total offense, #2 passing and #3 YPP places the Hoosiers firmly among USDA’s most dangerous attacks.
But the offense is also #26 rushing and hasn’t been as productive against the strongest user defenses encountered.
🛡️ DEFENSE ANALYSIS
The defense is much more disruptive than the scoring rank suggests.
Indiana sits #5 in sacks and #9 in interceptions while remaining respectable in total, pass and rush defense.
The major issue is red-zone defense.
📊 STAT PROFILE
One of USDA’s most explosive statistical offenses, but elite-user defenses have created the biggest question about its championship ceiling.
🏆 CONTENDER LEVEL: 7.5 / 10
The offensive ceiling absolutely looks championship caliber. The remaining question is whether Indiana can generate enough offense when opponents successfully take away the explosive passing game.
⸻
IOWA
⚔️ OFFENSE
PPG: 15.4 (#28)
YPG: 346.3 (#24)
YPP: 5.5 (#26)
Pass: 188.0 (#20)
Rush: 158.3 (#16)
3rd Down: 43% (#23)
Red Zone: 52% (#5)
🛡️ DEFENSE
PPG Allowed: 24.4 (#21)
YPG Allowed: 261.3 (#4)
Pass Allowed: 188.0 (#11)
Rush Allowed: 73.3 (#4)
Sacks: 20 (#13)
INT: 3 (#28)
Red-Zone TD Allowed: 33% (#15)
🎮 USER VALIDATION — 2/8 | 0-2
Michigan — L
Ohio State — L
⚔️ OFFENSE ANALYSIS
The offense simply isn’t converting possessions into points.
Iowa ranks last in scoring despite a strong #5 red-zone rate, suggesting many drives are ending before the offense gets into scoring territory.
🛡️ DEFENSE ANALYSIS
Raw yardage prevention is outstanding: #4 total defense and #4 rush defense.
But user games have produced a very different picture, with Michigan and Ohio State averaging 43.5 points.
📊 STAT PROFILE
Possibly USDA’s biggest raw-stat contradiction.
🏆 CONTENDER LEVEL: 3.0 / 10
The raw defensive profile is intriguing, but the combination of the league’s lowest scoring offense and poor user-game defensive results creates a difficult championship path.
⸻
LSU
⚔️ OFFENSE
PPG: 32.8 (#15)
YPG: 399.5 (#12)
YPP: 7.6 (#4)
Pass: 235.5 (#6)
Rush: 164.0 (#15)
3rd Down: 53% (#5)
Red Zone: 40% (#17)
🛡️ DEFENSE
PPG Allowed: 11.0 (#1)
YPG Allowed: 246.8 (#3)
Pass Allowed: 156.9 (#2)
Rush Allowed: 89.9 (#9)
Sacks: 24 (#8)
INT: 7 (#21)
Red-Zone TD Allowed: 33% (#15)
🎮 USER VALIDATION — 5/8 | 5-0
Clemson — W
Ole Miss — W
Texas A&M — W
Mississippi State — W
Auburn — W
⚔️ OFFENSE ANALYSIS
LSU’s #15 scoring rank undersells the offense.
The Tigers are #4 in YPP, #6 passing and #5 on third down. This is a highly efficient offense even if the raw PPG isn’t elite.
🛡️ DEFENSE ANALYSIS
This is one of the strongest defensive profiles in USDA.
#1 scoring defense, #3 total defense and #2 pass defense.
More importantly, the numbers have held almost perfectly across five user games: 11.0 PPG allowed overall versus 11.4 against users.
📊 STAT PROFILE
Perhaps the cleanest validation in USDA. LSU allows 11.0 overall and 11.4 against five users. That is contender-level repeatability.
🏆 CONTENDER LEVEL: 9.5 / 10
The defense is championship caliber by almost any measure and has already held up against significant user exposure. LSU doesn’t need a Top-5 scoring offense because its efficiency and defense consistently create favorable game environments.
⸻
MIAMI
⚔️ OFFENSE
PPG: 32.8 (#15)
YPG: 414.6 (#9)
YPP: 7.4 (#6)
Pass: 230.6 (#8)
Rush: 184.0 (#9)
3rd Down: 50% (#7)
Red Zone: 40% (#17)
🛡️ DEFENSE
PPG Allowed: 16.1 (#4)
YPG Allowed: 238.4 (#1)
Pass Allowed: 153.1 (#1)
Rush Allowed: 85.3 (#7)
Sacks: 26 (#5)
INT: 5 (#26)
Red-Zone TD Allowed: 25% (#5)
🎮 USER VALIDATION — 2/8 | 2-0
Clemson — W
Florida State — W
⚔️ OFFENSE ANALYSIS
Miami doesn’t have one gaudy offensive statistic, but the complete profile is excellent.
Top 10 in total offense, YPP, passing, rushing and third down means the Hurricanes can produce in multiple ways.
🛡️ DEFENSE ANALYSIS
Miami leads USDA in total defense and pass defense while also ranking #7 against the run, #5 in sacks and #5 in red-zone defense.
And it is doing this despite ranking only #26 in interceptions.
📊 STAT PROFILE
One of USDA’s most complete raw two-way profiles.
🏆 CONTENDER LEVEL: 8.5 / 10
The numbers strongly resemble a championship team. The only reason Miami isn’t even higher is that only two user games currently validate an otherwise elite defensive profile.
⸻
MICHIGAN
⚔️ OFFENSE
PPG: 38.5 (#3)
YPG: 442.9 (#3)
YPP: 9.1 (#1)
Pass: 199.0 (#16)
Rush: 243.9 (#1)
3rd Down: 51% (#6)
Red Zone: 34% (#23)
🛡️ DEFENSE
PPG Allowed: 18.4 (#7)
YPG Allowed: 339.5 (#23)
Pass Allowed: 202.3 (#14)
Rush Allowed: 137.3 (#26)
Sacks: 22 (#11)
INT: 13 (#6)
Red-Zone TD Allowed: 32% (#13)
🎮 USER VALIDATION — 4/8 | 3-1
Oklahoma — L
Iowa — W
Penn State — W
Indiana — W
⚔️ OFFENSE ANALYSIS
Michigan owns USDA’s most efficient offense.
9.1 YPP is #1, as is 243.9 rushing yards per game.
The Wolverines aren’t simply accumulating plays — they are generating enormous production every snap.
🛡️ DEFENSE ANALYSIS
The scoring defense is strong at #7, but the underlying yardage numbers are less dominant.
Michigan sits #23 in total defense and #26 against the run, though 13 interceptions have helped prevent those yards from becoming points.
📊 STAT PROFILE
The most efficient offense in USDA and one of the strongest recent user-game trends.
🏆 CONTENDER LEVEL: 9.0 / 10
The offense is unquestionably championship caliber. The primary concern is whether the defense can survive multiple elite offenses without requiring Michigan to consistently win through extraordinary offensive efficiency.
⸻
MISSISSIPPI STATE
⚔️ OFFENSE
PPG: 22.4 (#26)
YPG: 293.0 (#28)
YPP: 5.2 (#27)
Pass: 181.3 (#21)
Rush: 111.8 (#27)
3rd Down: 40% (#25)
Red Zone: 46% (#11)
🛡️ DEFENSE
PPG Allowed: 22.4 (#18)
YPG Allowed: 329.4 (#21)
Pass Allowed: 211.9 (#20)
Rush Allowed: 117.5 (#16)
Sacks: 17 (#22)
INT: 13 (#6)
Red-Zone TD Allowed: 26% (#7)
🎮 USER VALIDATION
User wins include Missouri and South Carolina, with losses to Alabama, LSU, Oklahoma and Texas.
⚔️ OFFENSE ANALYSIS
Mississippi State’s offense is near the bottom in virtually every production category.
The Bulldogs are #28 in total offense, #27 YPP and #27 rushing.
🛡️ DEFENSE ANALYSIS
Defense is significantly stronger.
The Bulldogs rank #6 in interceptions and #7 in red-zone TD defense, giving them two genuine possession-changing strengths.
📊 STAT PROFILE
Defense can compete; offense is creating the ceiling.
🏆 CONTENDER LEVEL: 4.5 / 10
The defense can keep Mississippi State in difficult games, but a championship run would require a dramatic offensive improvement.
⸻
MISSOURI
⚔️ OFFENSE
PPG: 26.8 (#21)
YPG: 358.6 (#20)
YPP: 6.6 (#17)
Pass: 159.8 (#26)
Rush: 198.9 (#8)
3rd Down: 50% (#7)
Red Zone: 50% (#7)
🛡️ DEFENSE
PPG Allowed: 19.0 (#8)
YPG Allowed: 266.1 (#5)
Pass Allowed: 167.6 (#4)
Rush Allowed: 98.5 (#10)
Sacks: 19 (#16)
INT: 9 (#18)
Red-Zone TD Allowed: 25% (#5)
🎮 USER VALIDATION — 5/8 | 1-4
Mississippi State — L
Florida — L
Texas A&M — L
Ole Miss — W
Arkansas — L
⚔️ OFFENSE ANALYSIS
Missouri’s identity is clear.
The Tigers rank #8 rushing, #7 on third down and #7 in the red zone, while sitting #26 passing.
This is a run-first possession offense.
🛡️ DEFENSE ANALYSIS
The raw numbers are excellent: #5 total defense, #4 pass defense and #5 red-zone defense.
But user opponents have averaged 27.2 PPG, compared with Missouri’s 19.0 full-season average.
📊 STAT PROFILE
Very good raw defensive numbers, but one of the clearest cases where user-game validation lowers confidence in the season average.
🏆 CONTENDER LEVEL: 6.0 / 10
The defensive foundation looks contender-worthy on paper, but the extensive user sample has not supported it at the same level.
⸻
NEBRASKA
⚔️ OFFENSE
PPG: 35.1 (#9)
YPG: 431.9 (#5)
YPP: 6.7 (#13)
Pass: 288.9 (#3)
Rush: 143.0 (#22)
3rd Down: 54% (#4)
Red Zone: 56% (#1)
🛡️ DEFENSE
PPG Allowed: 25.1 (#24)
YPG Allowed: 347.0 (#25)
Pass Allowed: 229.4 (#24)
Rush Allowed: 117.6 (#17)
Sacks: 15 (#26)
INT: 7 (#21)
Red-Zone TD Allowed: 19% (#2)
🎮 USER VALIDATION — 2/7 | 1-1
Indiana — L
Oregon — W
⚔️ OFFENSE ANALYSIS
Nebraska is one of USDA’s strongest offensive teams.
Top 5 in total yardage, Top 3 passing, Top 4 third down and #1 in red-zone efficiency.
The offense has also scored 42 and 37 in two user games.
🛡️ DEFENSE ANALYSIS
The red-zone defense is elite at #2, but most of the remaining profile is weak.
Nebraska sits #24 scoring defense, #25 total defense, #24 passing defense and #26 sacks.
📊 STAT PROFILE
Legitimate Top-5 offensive profile attached to one of USDA’s weaker statistical defenses.
🏆 CONTENDER LEVEL: 7.0 / 10
Nebraska can score with nearly anyone. The championship question is whether the defense can produce enough stops against multiple elite opponents in succession.
⸻
NOTRE DAME
⚔️ OFFENSE
PPG: 31.8 (#17)
YPG: 347.1 (#23)
YPP: 6.2 (#21)
Pass: 176.1 (#22)
Rush: 171.0 (#13)
3rd Down: 44% (#20)
Red Zone: 28% (#26)
🛡️ DEFENSE
PPG Allowed: 12.1 (#2)
YPG Allowed: 241.0 (#2)
Pass Allowed: 192.3 (#12)
Rush Allowed: 48.8 (#1)
Sacks: 31 (#3)
INT: 9 (#18)
Red-Zone TD Allowed: 30% (#10)
🎮 USER VALIDATION — 0/8
No user games.
⚔️ OFFENSE ANALYSIS
The offense is functional but not dominant.
Notre Dame ranks outside the Top 15 in scoring, total offense, YPP, passing and situational efficiency.
🛡️ DEFENSE ANALYSIS
The defense is statistically spectacular.
#2 scoring defense, #2 total defense, #1 rushing defense and #3 sacks.
Very few defenses possess that combination.
📊 STAT PROFILE
Potentially elite defense, but the largest unknown among the contenders.
🏆 CONTENDER LEVEL: 8.0 / 10
The defensive numbers absolutely look championship caliber. The uncertainty is significant: none of them have yet been tested against another user, and the offense doesn’t currently provide much statistical margin for defensive regression.
⸻
OHIO STATE
⚔️ OFFENSE
PPG: 45.8 (#1)
YPG: 434.1 (#4)
YPP: 8.6 (#2)
Pass: 338.3 (#1)
Rush: 95.9 (#28)
3rd Down: 45% (#17)
Red Zone: 32% (#24)
🛡️ DEFENSE
PPG Allowed: 20.6 (#13)
YPG Allowed: 310.1 (#15)
Pass Allowed: 210.5 (#19)
Rush Allowed: 99.6 (#11)
Sacks: 33 (#2)
INT: 15 (#3)
Red-Zone TD Allowed: 39% (#19)
🎮 USER VALIDATION — 3/8 | 1-2
Texas — L
Indiana — W
USC — L
⚔️ OFFENSE ANALYSIS
No offense has a higher statistical ceiling.
Ohio State is #1 in scoring, #1 passing and #2 in yards per play.
The enormous qualifier is the run game: #28 in USDA.
Against users, scoring has dropped from 45.8 to 28.7.
🛡️ DEFENSE ANALYSIS
Ohio State is a classic havoc defense.
The Buckeyes rank #2 in sacks and #3 in interceptions despite more ordinary yardage-prevention numbers.
📊 STAT PROFILE
USDA’s highest-ceiling passing offense, but one whose astronomical overall production has come back toward earth against stronger user competition.
🏆 CONTENDER LEVEL: 8.5 / 10
Few teams can overwhelm an opponent faster. The question is whether a nearly pass-exclusive offense can consistently survive multiple elite user defenses in a playoff environment.
⸻
OKLAHOMA
⚔️ OFFENSE
PPG: 35.6 (#6)
YPG: 430.4 (#6)
YPP: 7.5 (#5)
Pass: 188.3 (#19)
Rush: 242.1 (#2)
3rd Down: 50% (#7)
Red Zone: 32% (#24)
🛡️ DEFENSE
PPG Allowed: 15.1 (#3)
YPG Allowed: 294.0 (#10)
Pass Allowed: 178.3 (#7)
Rush Allowed: 115.8 (#15)
Sacks: 19 (#16)
INT: 13 (#6)
Red-Zone TD Allowed: 13% (#1)
🎮 USER VALIDATION — 4/8 | 3-1
Michigan — W
Texas — L
Mississippi State — W
South Carolina — W
⚔️ OFFENSE ANALYSIS
Oklahoma combines volume with explosiveness.
The Sooners are #6 scoring, #6 total offense, #5 YPP and #2 rushing.
The passing volume is modest, but it hasn’t prevented the offense from producing.
🛡️ DEFENSE ANALYSIS
This defense becomes especially difficult once opponents approach scoring territory.
Oklahoma ranks #3 in scoring defense, #7 against the pass, #6 in interceptions and #1 in red-zone TD defense at just 13%.
📊 STAT PROFILE
One of USDA’s cleanest contender builds — elite running game, excellent scoring defense and meaningful user validation.
🏆 CONTENDER LEVEL: 9.5 / 10
The profile is built for postseason football: elite rushing, scoring efficiency, defensive prevention and a red-zone defense capable of turning long drives into very few points.
⸻
OLE MISS
⚔️ OFFENSE
PPG: 33.5 (#13)
YPG: 380.4 (#14)
YPP: 6.7 (#13)
Pass: 204.9 (#14)
Rush: 175.5 (#12)
3rd Down: 44% (#20)
Red Zone: 53% (#3)
🛡️ DEFENSE
PPG Allowed: 21.3 (#14)
YPG Allowed: 316.4 (#17)
Pass Allowed: 186.4 (#10)
Rush Allowed: 130.0 (#21)
Sacks: 16 (#23)
INT: 11 (#13)
Red-Zone TD Allowed: 30% (#10)
🎮 USER VALIDATION — 5/8 | 1-4
LSU — L
Florida — L
Missouri — L
Texas — L
Auburn — W
⚔️ OFFENSE ANALYSIS
Ole Miss is balanced and excellent in the red zone, but there isn’t one category in which it overwhelms opponents.
Against users, scoring drops from 33.5 to 21.8 PPG.
🛡️ DEFENSE ANALYSIS
The defense is solidly middle-of-the-pack with a good #10 passing-defense ranking and #10 red-zone rate.
It lacks elite pressure or takeaway production.
📊 STAT PROFILE
Solid raw numbers, but extensive user-game evidence has not validated the offense at the same level.
🏆 CONTENDER LEVEL: 5.5 / 10
There are no catastrophic statistical flaws, but the user results indicate Ole Miss needs another level of offensive production to resemble the top championship profiles.
⸻
OREGON
⚔️ OFFENSE
PPG: 35.6 (#6)
YPG: 361.6 (#19)
YPP: 7.0 (#11)
Pass: 211.6 (#12)
Rush: 150.0 (#20)
3rd Down: 44% (#20)
Red Zone: 55% (#2)
🛡️ DEFENSE
PPG Allowed: 19.6 (#11)
YPG Allowed: 304.6 (#11)
Pass Allowed: 233.0 (#25)
Rush Allowed: 71.6 (#3)
Sacks: 21 (#12)
INT: 10 (#15)
Red-Zone TD Allowed: 59% (#28)
🎮 USER VALIDATION — 3/7 | 1-2
USC — W
UCLA — L
Nebraska — L
⚔️ OFFENSE ANALYSIS
Oregon scores efficiently despite only ranking #19 in total yardage.
The #2 red-zone offense is a major reason the Ducks convert moderate volume into Top-6 scoring.
🛡️ DEFENSE ANALYSIS
Oregon is outstanding against the run at #3 but vulnerable through the air and especially near the goal line.
The Ducks sit #25 in pass defense and #28 in red-zone TD defense.
📊 STAT PROFILE
Dangerous and capable of elite individual performances, but with major statistical contradictions.
🏆 CONTENDER LEVEL: 7.5 / 10
Oregon has enough high-end traits to beat elite teams, but the pass-defense/red-zone combination introduces volatility that the strongest profiles don’t have.
⸻
PENN STATE
⚔️ OFFENSE
PPG: 31.0 (#18)
YPG: 401.1 (#11)
YPP: 5.8 (#24)
Pass: 189.5 (#18)
Rush: 211.6 (#5)
3rd Down: 57% (#1)
Red Zone: 51% (#6)
🛡️ DEFENSE
PPG Allowed: 32.1 (#28)
YPG Allowed: 374.1 (#28)
Pass Allowed: 237.4 (#27)
Rush Allowed: 136.8 (#25)
Sacks: 18 (#19)
INT: 12 (#9)
Red-Zone TD Allowed: 21% (#4)
🎮 USER VALIDATION — 2/8 | 0-2
USC — L
Michigan — L
⚔️ OFFENSE ANALYSIS
Penn State has an unusual possession offense.
The Nittany Lions are #5 rushing and #1 on third down, yet #24 in yards per play.
They sustain drives rather than overwhelm defenses with explosiveness.
🛡️ DEFENSE ANALYSIS
This is the biggest problem.
Penn State is #28 in scoring defense and #28 total defense, and user opponents have averaged 57.5 points.
📊 STAT PROFILE
Strong possession-oriented offensive traits are being overwhelmed by major defensive problems.
🏆 CONTENDER LEVEL: 3.5 / 10
The offense has enough structure to compete, but the defensive profile currently makes a championship run extremely difficult.
⸻
SMU
⚔️ OFFENSE
PPG: 33.3 (#14)
YPG: 376.4 (#15)
YPP: 6.6 (#17)
Pass: 193.5 (#17)
Rush: 182.9 (#10)
3rd Down: 48% (#12)
Red Zone: 50% (#7)
🛡️ DEFENSE
PPG Allowed: 26.0 (#25)
YPG Allowed: 322.3 (#19)
Pass Allowed: 203.9 (#15)
Rush Allowed: 118.4 (#18)
Sacks: 16 (#23)
INT: 15 (#3)
Red-Zone TD Allowed: 46% (#25)
🎮 USER VALIDATION — 2/8 | 1-1
Florida State — L
Virginia — W
⚔️ OFFENSE ANALYSIS
SMU is balanced without being spectacular.
Top-10 rushing and Top-10 red-zone efficiency give the Mustangs a reliable base.
🛡️ DEFENSE ANALYSIS
Interceptions are the clear strength: 15, tied near the top of USDA.
The issue is preventing points consistently, where SMU ranks #25.
📊 STAT PROFILE
Capable offense, takeaway-producing defense, but not enough consistent prevention yet.
🏆 CONTENDER LEVEL: 5.5 / 10
SMU has enough offense and takeaway ability to be dangerous, but the scoring defense remains outside championship territory.
⸻
SOUTH CAROLINA
⚔️ OFFENSE
PPG: 34.9 (#11)
YPG: 443.5 (#2)
YPP: 7.4 (#6)
Pass: 263.1 (#4)
Rush: 180.4 (#11)
3rd Down: 47% (#14)
Red Zone: 48% (#10)
🛡️ DEFENSE
PPG Allowed: 26.8 (#27)
YPG Allowed: 346.0 (#24)
Pass Allowed: 215.6 (#22)
Rush Allowed: 130.4 (#22)
Sacks: 16 (#23)
INT: 9 (#18)
Red-Zone TD Allowed: 30% (#10)
🎮 USER VALIDATION — 4/8 | 1-3
Mississippi State — L
Alabama — W
Florida — L
Oklahoma — L
⚔️ OFFENSE ANALYSIS
South Carolina has an unquestioned high-level offense.
#2 total offense, #4 passing and #6 YPP, with enough rushing balance to prevent defenses from simply selling out against the pass.
🛡️ DEFENSE ANALYSIS
The defense is the opposite.
South Carolina sits #27 in scoring defense and #24 in total defense, without elite pressure or takeaway production to compensate.
📊 STAT PROFILE
Clear Top-10 offense attached to one of the league’s weakest scoring defenses.
🏆 CONTENDER LEVEL: 6.5 / 10
The offense is good enough to threaten anybody. The question is whether South Carolina can get enough defensive stops to win three or four elite matchups in succession.
⸻
TEXAS
⚔️ OFFENSE
PPG: 36.0 (#5)
YPG: 350.1 (#22)
YPP: 7.1 (#9)
Pass: 142.5 (#27)
Rush: 207.6 (#6)
3rd Down: 50% (#7)
Red Zone: 38% (#20)
🛡️ DEFENSE
PPG Allowed: 19.6 (#11)
YPG Allowed: 324.6 (#20)
Pass Allowed: 213.5 (#21)
Rush Allowed: 111.1 (#14)
Sacks: 31 (#3)
INT: 14 (#5)
Red-Zone TD Allowed: 38% (#18)
🎮 USER VALIDATION — 5/8 | 5-0
Ohio State — W
Oklahoma — W
Florida — W
Ole Miss — W
Mississippi State — W
⚔️ OFFENSE ANALYSIS
Texas is one of the league’s most efficient offensive teams.
The Longhorns rank only #22 in total yardage and #27 passing, yet sit #5 in scoring because the rushing attack, YPP and third-down efficiency consistently convert opportunities.
🛡️ DEFENSE ANALYSIS
Raw yardage ranks are ordinary, but disruption is elite.
Texas ranks #3 in sacks and #5 in interceptions.
That helps explain why opponents aren’t turning yardage into proportional scoring.
📊 STAT PROFILE
One of USDA’s most unusual but most validated contender profiles. The total-yardage ranking undersells the results dramatically.
🏆 CONTENDER LEVEL: 9.0 / 10
Five user games provide significant validation, and the style has repeatedly worked against strong opponents. The primary statistical question is how Texas responds if an opponent successfully forces the offense away from its preferred rushing identity.
⸻
TEXAS A&M
⚔️ OFFENSE
PPG: 25.0 (#25)
YPG: 364.6 (#17)
YPP: 6.0 (#23)
Pass: 227.3 (#9)
Rush: 137.4 (#24)
3rd Down: 46% (#16)
Red Zone: 42% (#14)
🛡️ DEFENSE
PPG Allowed: 19.4 (#10)
YPG Allowed: 306.6 (#14)
Pass Allowed: 171.3 (#5)
Rush Allowed: 135.4 (#24)
Sacks: 15 (#26)
INT: 11 (#13)
Red-Zone TD Allowed: 41% (#23)
🎮 USER VALIDATION — 3/8 | 0-3
LSU — L
Arkansas — L
Alabama — L
⚔️ OFFENSE ANALYSIS
A&M has respectable passing production at #9, but that hasn’t translated into scoring.
The Aggies sit #25 in points and have averaged only 10.0 PPG against users.
🛡️ DEFENSE ANALYSIS
The raw defense is considerably stronger.
A&M ranks #10 scoring defense and #5 against the pass.
But user opponents have scored 30.0 PPG, substantially above the season average.
📊 STAT PROFILE
The overall defensive numbers are respectable, but user-game performance has been significantly worse than the season averages.
🏆 CONTENDER LEVEL: 4.5 / 10
The defensive foundation provides some upside, but the offense has not yet demonstrated enough production against user competition to resemble a championship team.
⸻
UCLA
⚔️ OFFENSE
PPG: 40.0 (#2)
YPG: 424.3 (#7)
YPP: 7.0 (#11)
Pass: 206.4 (#13)
Rush: 217.9 (#4)
3rd Down: 56% (#3)
Red Zone: 53% (#3)
🛡️ DEFENSE
PPG Allowed: 19.0 (#8)
YPG Allowed: 290.9 (#8)
Pass Allowed: 208.3 (#16)
Rush Allowed: 82.6 (#6)
Sacks: 26 (#5)
INT: 12 (#9)
Red-Zone TD Allowed: 36% (#17)
🎮 USER VALIDATION — 1/8 | 1-0
Oregon — W
⚔️ OFFENSE ANALYSIS
UCLA’s offense has very few weaknesses.
#2 scoring, #4 rushing, #3 third down and #3 red zone gives the Bruins one of USDA’s most complete offensive profiles.
🛡️ DEFENSE ANALYSIS
The defense is similarly balanced.
Top 8 scoring, total yardage and rushing defense, plus #5 sacks and #9 interceptions.
No single weakness jumps off the page.
📊 STAT PROFILE
Statistically one of the most complete teams in USDA. The remaining question is not quality of numbers — it’s how they translate as user-game volume increases.
🏆 CONTENDER LEVEL: 9.0 / 10
On raw profile alone, UCLA looks absolutely championship caliber. The only meaningful caveat is sample validation: just one of eight games has come against another user.
⸻
USC
⚔️ OFFENSE
PPG: 36.4 (#4)
YPG: 420.7 (#8)
YPP: 7.2 (#8)
Pass: 252.9 (#5)
Rush: 167.8 (#14)
3rd Down: 45% (#17)
Red Zone: 41% (#15)
🛡️ DEFENSE
PPG Allowed: 16.8 (#5)
YPG Allowed: 279.5 (#6)
Pass Allowed: 220.1 (#23)
Rush Allowed: 59.4 (#2)
Sacks: 39 (#1)
INT: 10 (#15)
Red-Zone TD Allowed: 19% (#2)
🎮 USER VALIDATION — 3/9 | 2-1
Oregon — L
Penn State — W
Ohio State — W
⚔️ OFFENSE ANALYSIS
USC has one of the cleanest high-level offensive profiles in the league.
Top 5 scoring and passing, Top 10 total offense and YPP, with enough rushing production to maintain balance.
The user-game offense averages 37.0 PPG, almost identical to the 36.4 season average.
🛡️ DEFENSE ANALYSIS
USC owns the league’s most disruptive front.
#1 sacks, #2 rushing defense and #2 red-zone defense gives the Trojans three elite defensive traits.
Pass yardage allowed is the statistical weakness, but the overall scoring prevention remains Top 5.
📊 STAT PROFILE
Few teams combine elite scoring, explosive offense, dominant run defense, pressure and red-zone defense this well.
🏆 CONTENDER LEVEL: 9.5 / 10
This profile has nearly every championship ingredient: Top-5 scoring, defensive disruption, run suppression and strong user-game replication. The smaller user sample prevents complete certainty, but the available evidence is extremely strong.
⸻
VIRGINIA
⚔️ OFFENSE
PPG: 26.3 (#23)
YPG: 365.8 (#16)
YPP: 6.2 (#21)
Pass: 142.2 (#28)
Rush: 223.6 (#3)
3rd Down: 57% (#1)
Red Zone: 41% (#15)
🛡️ DEFENSE
PPG Allowed: 22.5 (#19)
YPG Allowed: 288.0 (#7)
Pass Allowed: 209.6 (#17)
Rush Allowed: 78.4 (#5)
Sacks: 23 (#9)
INT: 5 (#26)
Red-Zone TD Allowed: 27% (#8)
🎮 USER VALIDATION — 2/9 | 0-2
Florida State — L
SMU — L
⚔️ OFFENSE ANALYSIS
Virginia has one of the clearest identities in USDA.
The Cavaliers rank #3 rushing and #1 on third down, but dead last in passing.
They want to control games through possession and the ground attack.
🛡️ DEFENSE ANALYSIS
The defense is quietly good.
Virginia ranks #7 in total defense, #5 rushing defense, #9 sacks and #8 red-zone defense.
The missing ingredient is takeaways.
📊 STAT PROFILE
A highly specialized team with several genuinely elite traits, but a narrow offensive path.
🏆 CONTENDER LEVEL: 6.0 / 10
The defense and rushing game offer a viable formula, but the extreme lack of passing production significantly reduces margin for error against top opponents.
⸻
🏆 FINAL TOP 10 OFFENSES
1. Michigan
38.5 PPG (#3) | 442.9 YPG (#3) | 9.1 YPP (#1) | 243.9 Rush (#1)
The most efficient offense in USDA.
2. UCLA
40.0 PPG (#2) | 424.3 (#7) | 217.9 Rush (#4) | 56% 3D (#3)
Few weaknesses and elite situational production.
3. Ohio State
45.8 PPG (#1) | 338.3 Pass (#1) | 8.6 YPP (#2)
The most explosive passing profile in USDA.
4. Nebraska
35.1 (#9) | 431.9 (#5) | 288.9 Pass (#3) | 54% 3D (#4) | 56% RZ (#1)
Outstanding drive sustainability.
5. Oklahoma
35.6 (#6) | 430.4 (#6) | 7.5 YPP (#5) | 242.1 Rush (#2)
Elite ground production with strong overall efficiency.
6. USC
36.4 (#4) | 420.7 (#8) | 7.2 (#8) | 252.9 Pass (#5)
High-level production with strong balance.
7. Indiana
461.3 YPG (#1) | 332.7 Pass (#2) | 7.8 YPP (#3)
Enormous production, though stronger user defenses have reduced it.
8. South Carolina
443.5 YPG (#2) | 263.1 Pass (#4) | 7.4 YPP (#6)
One of USDA’s best pure yardage offenses.
9. LSU
399.5 (#12) | 7.6 YPP (#4) | 235.5 Pass (#6) | 53% 3D (#5)
Better efficiency than its scoring rank suggests.
10. Texas
36.0 PPG (#5) | 207.6 Rush (#6) | 50% 3D (#7)
Efficiency and extensive user validation overcome modest yardage volume.
⸻
🛡️ FINAL TOP 10 DEFENSES
1. USC
16.8 PPG (#5) | 279.5 (#6) | 59.4 Rush (#2) | 39 Sacks (#1) | 19% RZ (#2)
2. Oklahoma
15.1 PPG (#3) | 178.3 Pass (#7) | 13 INT (#6) | 13% RZ (#1)
3. LSU
11.0 PPG (#1) | 246.8 (#3) | 156.9 Pass (#2)
4. Miami
238.4 YPG (#1) | 153.1 Pass (#1) | 16.1 PPG (#4) | 26 Sacks (#5)
5. Notre Dame
12.1 PPG (#2) | 241.0 (#2) | 48.8 Rush (#1) | 31 Sacks (#3)
6. UCLA
19.0 (#8) | 290.9 (#8) | 82.6 Rush (#6) | 26 Sacks (#5)
7. Texas
19.6 (#11) | 31 Sacks (#3) | 14 INT (#5)
8. Michigan
18.4 PPG (#7) | 13 INT (#6)
9. Ohio State
20.6 PPG (#13) | 33 Sacks (#2) | 15 INT (#3)
10. Missouri
19.0 PPG (#8) | 266.1 YPG (#5) | 167.6 Pass (#4) | 25% RZ (#5)
⸻
👑 FINAL TOP 10 OVERALL STAT PROFILES
1. USC
Offense #6 | Defense #1 | Contender Level: 9.5
Elite scoring paired with USDA’s premier disruption/run-defense profile.
2. Oklahoma
Offense #5 | Defense #2 | Contender Level: 9.5
A postseason-friendly formula: elite rushing, scoring defense and red-zone prevention.
3. UCLA
Offense #2 | Defense #6 | Contender Level: 9.0
Arguably USDA’s cleanest raw statistical balance, with user validation being the only major unknown.
4. Michigan
Offense #1 | Defense #8 | Contender Level: 9.0
The league’s most efficient offense. Defensive yardage is the major vulnerability.
5. LSU
Offense #9 | Defense #3 | Contender Level: 9.5
The strongest combination of elite defensive production and extensive user-game validation.
6. Ohio State
Offense #3 | Defense #9 | Contender Level: 8.5
Elite passing offense and elite defensive havoc, with offensive user-game regression worth monitoring.
7. Miami
Offense #11 | Defense #4 | Contender Level: 8.5
One of USDA’s cleanest two-way profiles.
8. Texas
Offense #10 | Defense #7 | Contender Level: 9.0
Statistically unconventional, but perhaps the most thoroughly user-validated contender formula.
9. Indiana
Offense #7 | Defense #18 | Contender Level: 7.5
Championship-level offensive ceiling; defensive and elite-opponent consistency remain the questions.
10. Oregon
Offense #12 | Defense #12 | Contender Level: 7.5
Enough high-end traits to beat elite opponents, but more statistical volatility than the teams above.
⸻
🔥 WHAT THE TWO-THIRDS MARK IS REVEALING
The title picture is beginning to split into different types of contenders.
USC, Oklahoma, LSU, Michigan and UCLA currently have the strongest overall statistical foundations.
But those foundations look very different.
USC brings balance and overwhelming defensive disruption.
Oklahoma brings a dominant rushing identity and the league’s best red-zone defense.
LSU brings the most validated elite defense in USDA.
Michigan brings the most efficient offense in the league.
UCLA brings perhaps the fewest statistical weaknesses of anyone.
Then comes another group with legitimate championship traits but more specific questions.
Texas has already repeatedly validated an unconventional efficiency-and-havoc formula.
Ohio State can produce offense at a level almost nobody can match, but the user results have been considerably closer to earth than the season averages.
Miami has one of USDA’s most balanced two-way stat sheets, but still needs a larger user sample.
Indiana can generate extraordinary offensive production, but its toughest defensive opponents have exposed some limits.
Florida has survived more user-game testing than anybody and continues scoring at essentially the same rate.
And then there are teams such as Notre Dame, Nebraska, South Carolina, Arkansas and Oregon that possess genuine elite traits — but also one major question capable of defining their postseason ceiling.
At this point in the season, almost every contender has shown us its preferred formula.
The final third will determine something much more important:
Which formulas still work when everybody knows exactly what’s coming?